public_sonata_ai_landing
Benchmark Correction and Stability-First Engineering
Document: 04 of 10
Status: Public Dossier (L4)
Source reference: benchmark_phase20.md, TinyStories BPE live run 2026-06-18
Initial faster result
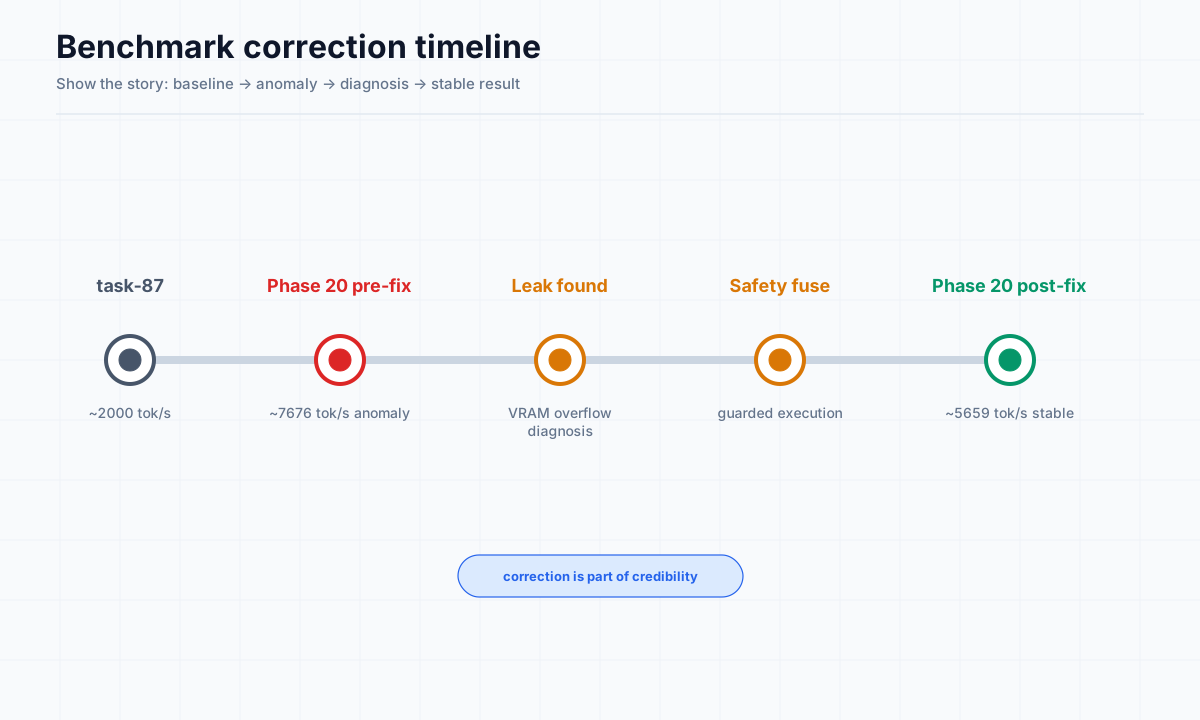
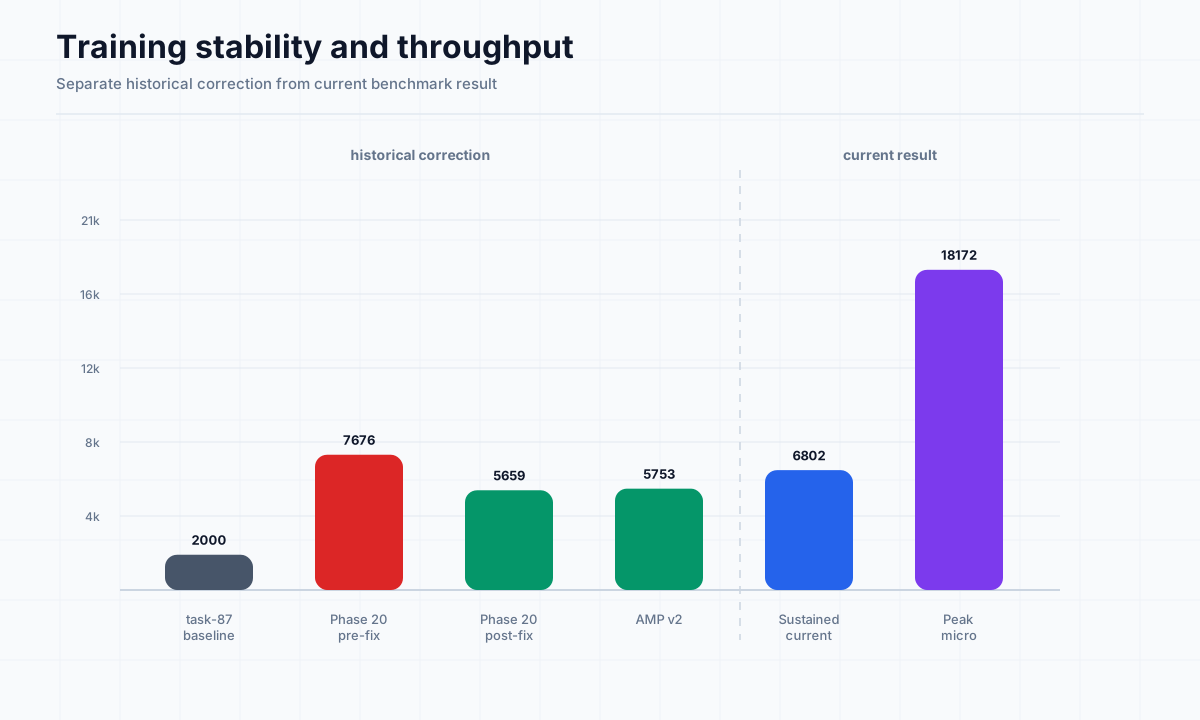
During Phase 20 benchmarking, the project initially reported a throughput of approximately 7,676 tok/s on an RTX 2070 Super (Batch=7, Seq=256). This result was faster than the previous baseline (~2,000 tok/s) by a factor of approximately 3.8x and appeared to demonstrate significant optimization progress.
Memory leaks and VRAM overflow interpretation
Closer analysis revealed that the higher throughput was an artifact of unsafe memory behavior:
- Memory leaks: Intermediate activations that should have been freed after the backward pass remained in VRAM, creating the appearance of full GPU utilization while actually occupying memory with unreleased allocations.
- VRAM overflow: Actual memory consumption exceeded the 8 GB physical VRAM limit. The CUDA driver began using system RAM as swap, which added latency but paradoxically maintained throughput through parallelism while hiding instability.
- No safety fuse: The memory allocator had no emergency check, allowing unbounded allocation that led to fragmentation, corrupted state, and non-deterministic results.
- Unstable computation: Memory corruption could produce NaN/Inf values under continued operation, and results were not reproducible.
Post-fix stable result
After implementing memory discipline fixes (correct activation freeing, VRAM emergency allocator guard, deterministic allocation patterns), the same benchmark configuration produced:
| Metric | Pre-fix | Post-fix |
|---|---|---|
| Throughput | ~7,676 tok/s | ~5,659 tok/s |
| VRAM usage | ~6.9 GB (overflow masked) | ~4.2 GB (clean) |
| Stability | Unstable (NaN, crashes) | Stable |
| Reproducibility | Non-reproducible | Reproducible |
| Memory safety | Leaks, overflow | Clean |
Why lower stable throughput is more valuable
The regression of approximately 26% in raw throughput is not a bug — it is a fix. The post-fix numbers reflect actual system performance under safe, reproducible conditions:
- Lower throughput that is deterministic and reproducible is more scientifically useful than higher throughput that cannot be relied upon.
- Memory-safe execution prevents silent corruption that would invalidate any training results.
- The safety fuse (emergency allocator guard) prevents the system from exceeding physical VRAM and swapping to host memory, which would catastrophically slow training under larger configurations.
Lessons for future benchmarks
- Always measure memory safety alongside throughput. A fast result that leaks memory or overflows VRAM is not a valid benchmark.
- Stability before optimization. The project’s decision to fix memory discipline before chasing higher numbers is an engineering priority that should continue.
- Document the failure. The existence of this correction note is itself evidence of engineering discipline.
- Ceiling awareness within model context. The Phase 20 model configuration showed a stable ceiling of ~6,000 tok/s on this hardware. A different, smaller model (TinyStories BPE, 182K params) achieves ~7,000-8,500 tok/s sustained with profile-default batch sizing, and up to ~18,000 tok/s in a peak micro-benchmark. The meaningful ceiling is hardware- and model-dependent.
Why this matters
This document may be one of the strongest trust-building artifacts in the public dossier. It shows correction, not self-promotion — the project identified an inflated benchmark, diagnosed its cause, fixed the underlying issue, and accepted a lower number because it is the correct one.
Current relevance
The Phase 20 correction story is a historical record of the project’s engineering discipline. Subsequent TinyStories BPE sustained training (document 03) achieves ~6,800 tok/s overall with profile-default settings, and up to ~18,000 tok/s in a peak micro-benchmark. The correction itself remains valid: the pre-fix Phase 20 result was an artifact of memory leaks, and the post-fix Phase 20 result is the accurate baseline for that configuration.